


203 Arthur Street, Blue Mountains, Ontario N0H 2P0 is For Sale and has a listing price of 499,000. The property is located in the The Blue Mountains neighbourhood . It's been on the website for 71 Days.
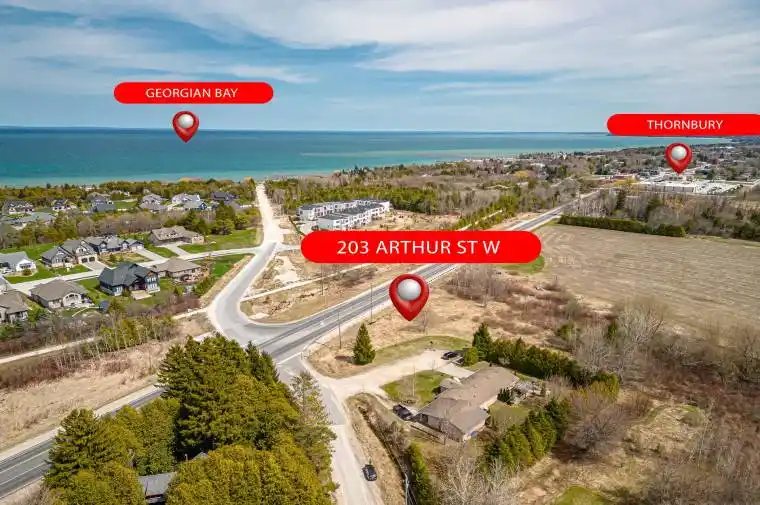
Welcome to the beautiful town of Thornbury. Located on the west side of town, this property offers endless potential for either residential or commercial uses. Previously approved for a 3 storey build with water view potential from the third floor or rooftop patio. Room to build your dream home near downtown Thornbury, Georgian Bay, beaches, golf courses, ski hills and everything else this area has to offer. Alternatively, it could also be ideal for commercial build purposes with its potential use of the exposure it has to Arthur St/Highway 26. Just down the road from a future large retirement and recreational community, this ever growing area offers lots of opportunities. Enjoy the 4 seasons living here in Thornbury with a host of local amenities in this always exciting town right at your fingertips. Further information available regarding potential for plans both residential and commercial. Reach out for more information or to book your showing today!
| List Date | MLS ID | List Price | Status | End Date | Closed Price |
|---|---|---|---|---|---|
| 07/30/2025 | X12314391 | $499,000 | For Sale | - | - |
| 04/24/2025 | X12102523 | $599,000 | Withdrawn | 07/25/2025 | - |